/tools/cmd/am-dbg/README.md
am-dbg TUI Debugger
am-dbg is a lightweight, multi-client debugger which can handle hundreds of simultaneous streams from async state
machines. It’s built around a timeline of transitions and allows for precise searches and drill-downs of state
mutations.
Installation
go install github.com/pancsta/asyncmachine-go/tools/cmd/am-dbg@latest
go run github.com/pancsta/asyncmachine-go/tools/cmd/am-dbg@latest
Demo
Interactively use the TUI debugger with data pre-generated by a secai bot:
go run github.com/pancsta/asyncmachine-go/tools/cmd/am-dbg@latest \
  --import-data https://assets.asyncmachine.dev/am-dbg-exports/secai-cook.gob.br \
  mach://cook
Features
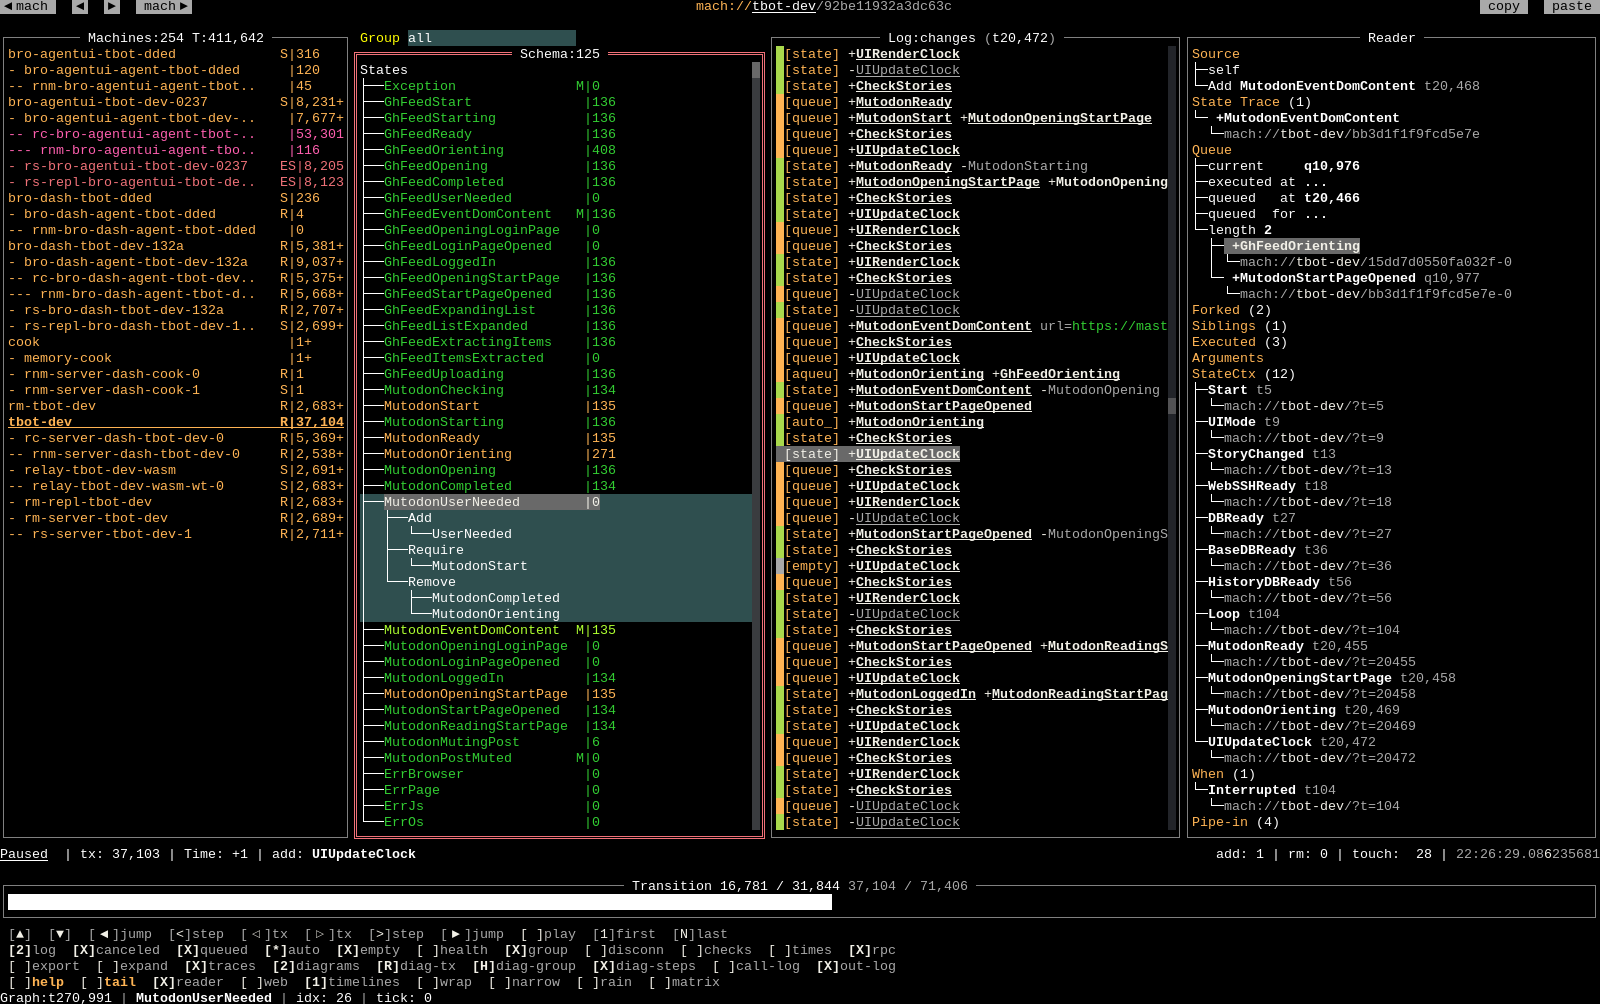
- states tree: list of all states and relations of the selected state machine, with their clock ticks, search-as-you-type, and error highlighting.
- log view: highlighted log view with the current transition being selected.
- address bar: navigate the hitory with 2 entries per machine.
- stepping through transitions: draws relations graph lines of the resolutions process in the states tree.
- time travel: transition and steps timelines allow to navigate in time, even between different state machines.
- transition info: show number, machine time, type, states, states, and human time of each transition.
- import / export: using Brotli and
encoding/gob, it’s easy to save and share dump files. - filters: filters narrow down both the number of transitions, and log messages.
- rain view: high-level view of transitions with error highlighting and human time, one per line.
- client list: all the currently nad previously connected state machines, with search-as-you-type, error highlighting, and remaining transitions marker.
- fast jumps: jump by 100 transitions, or select a state from the tree and jump to its next occurrence.
- keyboard navigation: the UI is keyboard accessible, just press the ? key.
- mouse support: most elements can be clicked and scrolled.
- SSH access: an instance of the debugger can be shared directly from an edge server via a built-in SSH server.
- log rotation: older entries will be automatically discarded in order.
- URLs and history: URL support for locations and history
- MCP server: the debugger can be controlled from an AI model, including TUI snapshots
- REPL access: the debugger can be controlled from a readline REPL
- log reader: extract entries from LogOps and SemLogger into a dedicated pane.
- source event: navigate to source events, internal or external.
- state trace: state-based equivalent of stack traces
- queue: shows the full queue, queued and executed times for this mutation.
- handlers: list executed handlers.
- contexts: list state contexts and mach time.
- subscriptions: list awaited clocks.
- piped states: list all inbound and outbound pipes.
- partial layout: some elements of the UI can be hidden, so many instances can create dashboards
- headless mode: the UI can be requested via SSH, allowing the debugger to start without PTY.
- files: various files are created in
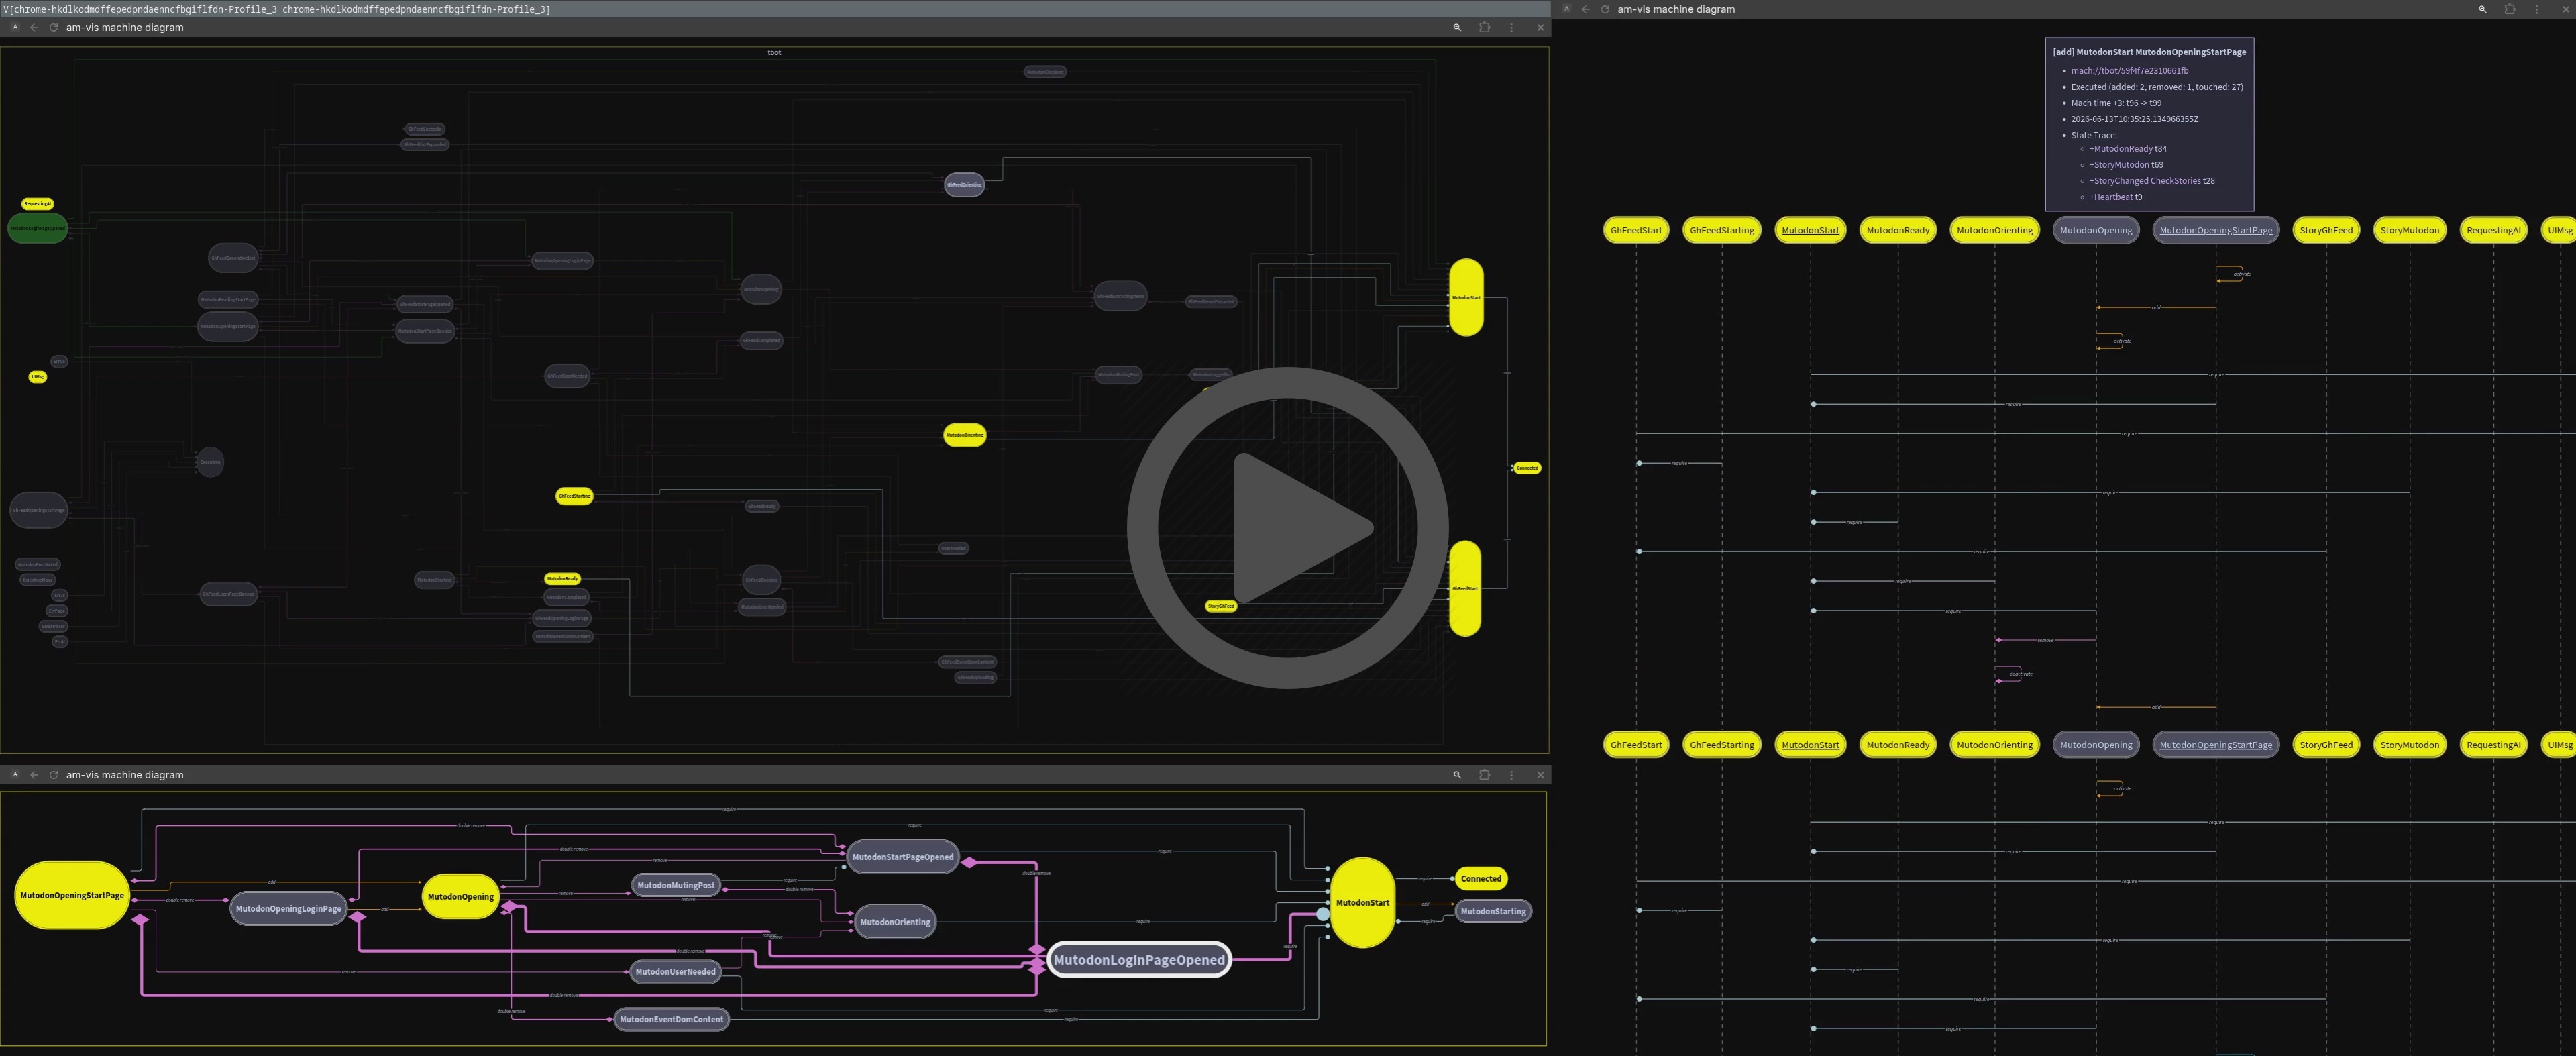
--dir. - diagrams: live diagrams for: graph, machine, state, and steps.
Usage: am-dbg [--listen-addr LISTEN-ADDR] [--dir DIR] [--clean-on-connect] [--import-data IMPORT-DATA] [--fwd-data FWD-DATA] [--select-connected] [--enable-clipboard] [--enable-mouse] [--filter-auto] [--filter-auto-canceled] [--filter-canceled] [--filter-checks] [--filter-disconn] [--filter-empty] [--filter-group] [--filter-health] [--filter-log-level FILTER-LOG-LEVEL] [--filter-queued] [--output-clients] [--output-diagrams OUTPUT-DIAGRAMS] [--output-diag-group OUTPUT-DIAG-GROUP] [--output-diag-tx OUTPUT-DIAG-TX] [--output-graph] [--output-log] [--output-tx] [--ui-mcp] [--ui-ssh] [--ui-web] [--version] [--view VIEW] [--view-log-wrap] [--view-narrow] [--view-rain] [--view-reader] [--view-tail] [--view-theme VIEW-THEME] [--view-timelines VIEW-TIMELINES] [--log-ops-ttl LOG-OPS-TTL] [--max-mem MAX-MEM] [--dbg-am-dbg-addr DBG-AM-DBG-ADDR] [--dbg-go-race] [--dbg-id DBG-ID] [--dbg-log-level DBG-LOG-LEVEL] [--dbg-otel] [--dbg-prof-srv DBG-PROF-SRV] [--dbg-repl] [MACHURL]

Positional arguments:
  MACHURL                Machine URL to connect to

Options:
  --listen-addr LISTEN-ADDR, -l LISTEN-ADDR
                         Host and port for the debugger to listen on [default: localhost:6831]
  --dir DIR, -d DIR      Output directory for generated files [default: .]
  --clean-on-connect     Clean up disconnected clients on the 1st connection [default: true]
  --import-data IMPORT-DATA, -i IMPORT-DATA
                         Import an exported gob.br file
  --fwd-data FWD-DATA, -f FWD-DATA
                         Forward incoming data to other instances (repeatable)
  --select-connected, -c
                         Select the newly connected machine, if no other is connected
  --enable-clipboard     Enable clipboard support [default: true]
  --enable-mouse         Enable mouse support [default: true]
  --filter-auto          Filter automatic transitions
  --filter-auto-canceled
                         Filter automatic canceled transitions
  --filter-canceled      Filter canceled transitions
  --filter-checks        Filter check (read-only) transitions
  --filter-disconn       Filter disconnected clients
  --filter-empty         Filter empty transitions
  --filter-group         Filter transitions by a selected group [default: true]
  --filter-health        Filter health-check transitions
  --filter-log-level FILTER-LOG-LEVEL
                         Filter transitions up to this log level, 0-5 (silent-everything) [default: 2]
  --filter-queued        Filter queued transitions
  --output-clients       Write a detailed client list into clients.txt inside --dir
  --output-diagrams OUTPUT-DIAGRAMS
                         Level of details for machine graph diagrams (svg, d2, mermaid) in --dir (0 off, 1-3 on) (EXPERIMENTAL)
  --output-diag-group OUTPUT-DIAG-GROUP
                         Only show states from the selected group (valid: hide, skip) [default: hide]
  --output-diag-tx OUTPUT-DIAG-TX
                         Dim states and rels unrelated to a transition (valid: called, changed, touched, relations) [default: relations]
  --output-graph         Write the current network graph as graph.(md|mgml) inside --dir (EXPERIMENTAL)
  --output-log           Write the current log buffer to log.txt inside --dir
  --output-tx            Write the current transition with steps into tx.md / d2 / mermaid / txt inside --dir (EXPERIMENTAL) [default: true]
  --ui-mcp               Enable MCP server on port 62626 (EXPERIMENTAL)
  --ui-ssh               Enable SSH headless mode on port --listen-addr +2 (EXPERIMENTAL)
  --ui-web               Start a web server for --dir and diagrams on --listen-addr +1 (EXPERIMENTAL) [default: true]
  --version              Print version and exit
  --view VIEW, -v VIEW   Initial view (tree-log, tree-matrix, matrix) [default: tree-log]
  --view-log-wrap        Wrap log lines
  --view-narrow          Force a narrow view, independently of the viewport size
  --view-rain            Show the rain view
  --view-reader, -r      Show the log reader view
  --view-tail            Start from the latest tx [default: true]
  --view-theme VIEW-THEME
                         Color theme (dark, light) [default: dark]
  --view-timelines VIEW-TIMELINES
                         Number of timelines to show (0-2) [default: 2]
  --log-ops-ttl LOG-OPS-TTL
                         Max time to live for logs level LogOps [default: 1h]
  --max-mem MAX-MEM      Max memory usage (in MB) to flush old transitions [default: 1000]
  --dbg-am-dbg-addr DBG-AM-DBG-ADDR
                         Debug this instance of am-dbg with another one
  --dbg-go-race          Go race detector is enabled
  --dbg-id DBG-ID        ID of this instance [default: am-dbg]
  --dbg-log-level DBG-LOG-LEVEL
                         Log level produced by this instance, 0-5 (silent-everything) [default: 0]
  --dbg-otel             Enable OpenTelemetry tracing for this instance
  --dbg-prof-srv DBG-PROF-SRV
                         Start pprof server
  --dbg-repl             Start a REPL server in --dir
  --help, -h             display this help and exit

Steps to Debug
Set up telemetry
import amhelp "github.com/pancsta/asyncmachine-go/pkg/helpers"
// ...
// var myMach *am.Machine
// var myMach am.Api
amhelp.MachDebugEnv(myMach)
Start
am-dbg --dir tmpRun your code with
# 1 expands to localhost:6831
AM_DBG_ADDR=1
# 3 is LogOps level
AM_LOG=3
# enable semantic logging
AM_LOG_FULL=1
Your machine should show up in the debugger
Dashboards

Small-scale dashboards can be achieved by using the --fwd-data param, with multiple instances of am-dbg as
destinations. It will duplicate all the memory allocations and won’t scale far, but it will work. Check out
/config/dashboards directory for preconfigured zellij layouts.
monorepo
Go back to the monorepo root to continue reading.