/examples/wasm_workflow/README.md
- Code: code.asyncmachine.dev
- Code: GitHub
WASM Workflow

An example workflow with 4 browser threads and 1 external Orchestrator, performing DAG-shaped hashing computations. To increase unpredictability, the workflow produces random errors - corrupted hashes and plain failures. The Orchestrator then retries a specific node or re-starts the whole workflow.
Machines:
orchestrator(server)browser1(browser UI thread)browser2(browser WebWorker, Dispatcher)browser3(browser WebWorker)browser4(browser WebWorker)
Implementation
Single direction aRPC connections starting from the Orchestrator, which mutates workers. The Dispacher has prefixed
states piped from leaf workers. WebWorkers talk to each other over MessageChannel,
ports, and transfered ArrayBuffer (copy-less). The data comes back to the Orchestrator via
SendPayload()-ServerPayloadState() flow. Technically, the data retuned by each node always passes through the
Orchestrator to simplify the example. In real world workflows, the connection would be full-duplex and
data flow without detours.
All the browser threads run the same Golang binary.
   - .
   - ├── cmd
   - │   ├── browser
9.0k │   │   ├── browser.go
5.2k │   │   ├── browser_machs.go
2.2k │   │   └── browser_test.go
   - │   └── orchestrator
 12k │       └── orchestrator.go
 780 ├── config.env
1.0k ├── conn_nowasm.go
2.4k ├── conn_wasm.go
3.7k ├── example_workflow.go
4.1k ├── README.md
   - ├── states
9.5k │   ├── ss_workflow.go
 851 │   └── states_utils.go
1.5k ├── Taskfile.yml
   - ├── tmp
  15 │   ├── orchestrator.addr
  15 │   ├── repl-browser1.addr
  15 │   ├── repl-browser3.addr
  15 │   └── repl-browser4.addr
   - └── web
 914     ├── index.html
 32M     ├── main.wasm
 17k     ├── wasm_exec.js
 291     └── worker.js
Start Demo
The default config exits after the workflow completes. You can unset EXIT_ON_COMPLETED to keep it alive.
git clone https://github.com/pancsta/asyncmachine-go.git
./scripts/dep-taskfile.sh
go mod tidy
cd examples/wasm_workflow
task dbg #tty1
task traces #tty2
task start #tty3
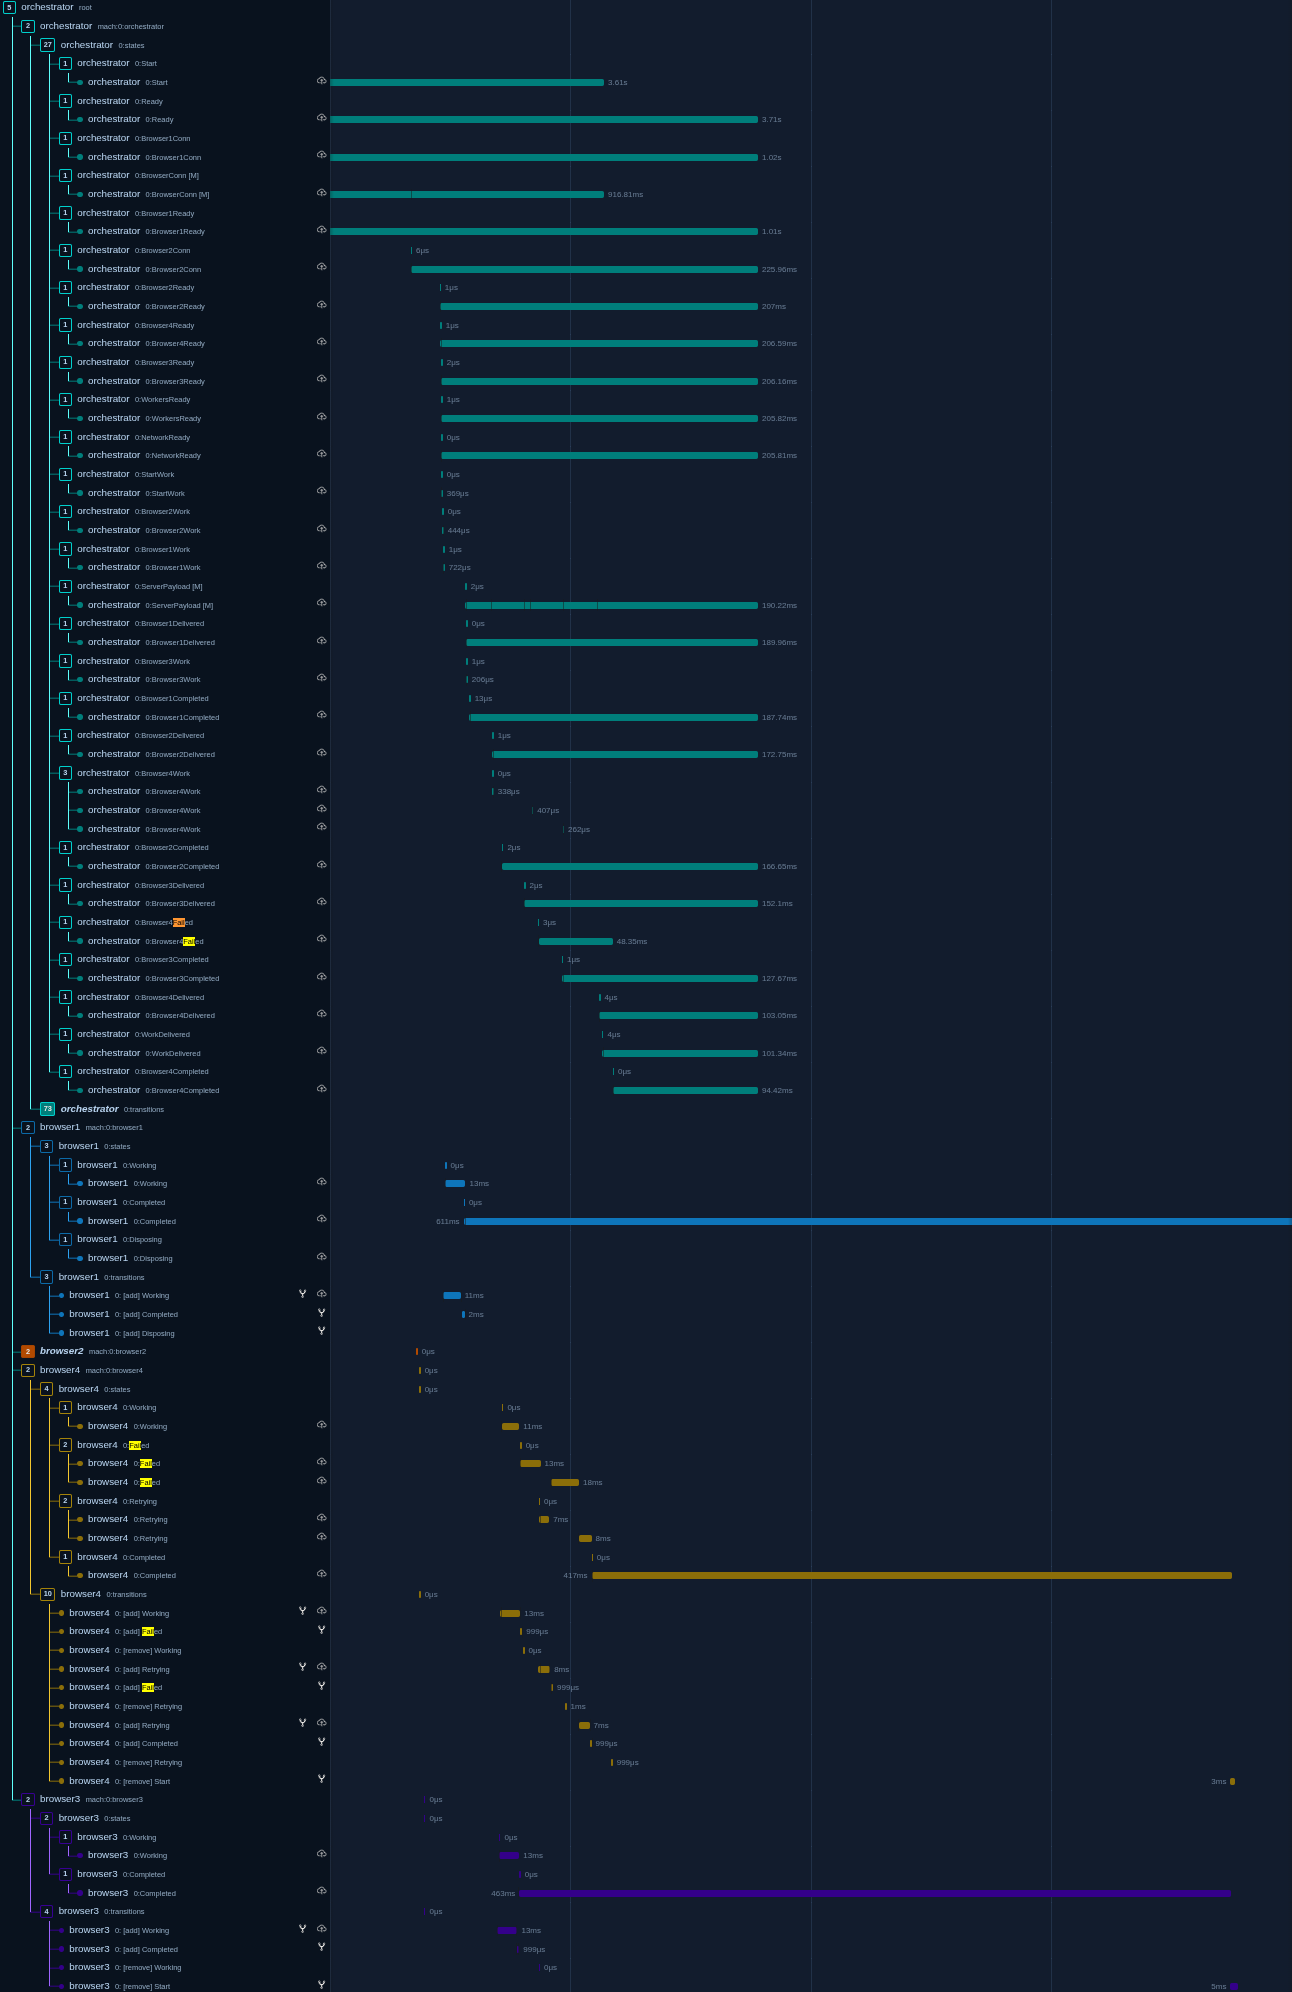
Traces
OpenTelemetry traces are generated automatically for each state-machine, with nonimportant ones being filtered out. You can browse the results in Jaeger.
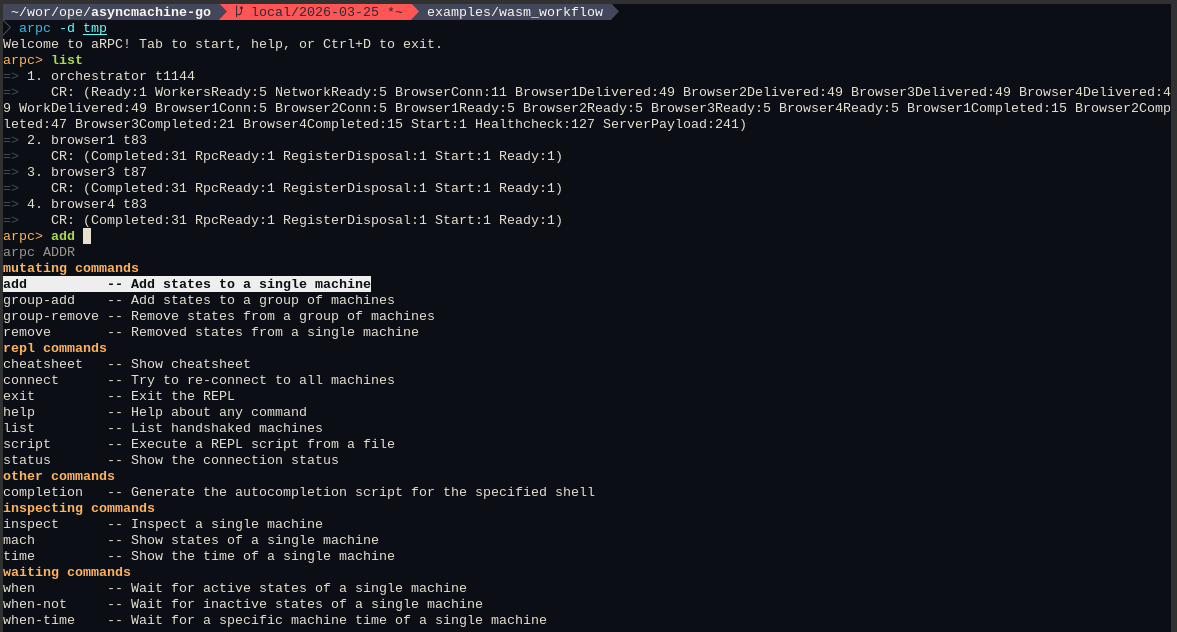
Debugger
Each node connects directly to the debugger and tunnels a TCP port for incoming REPL connections.
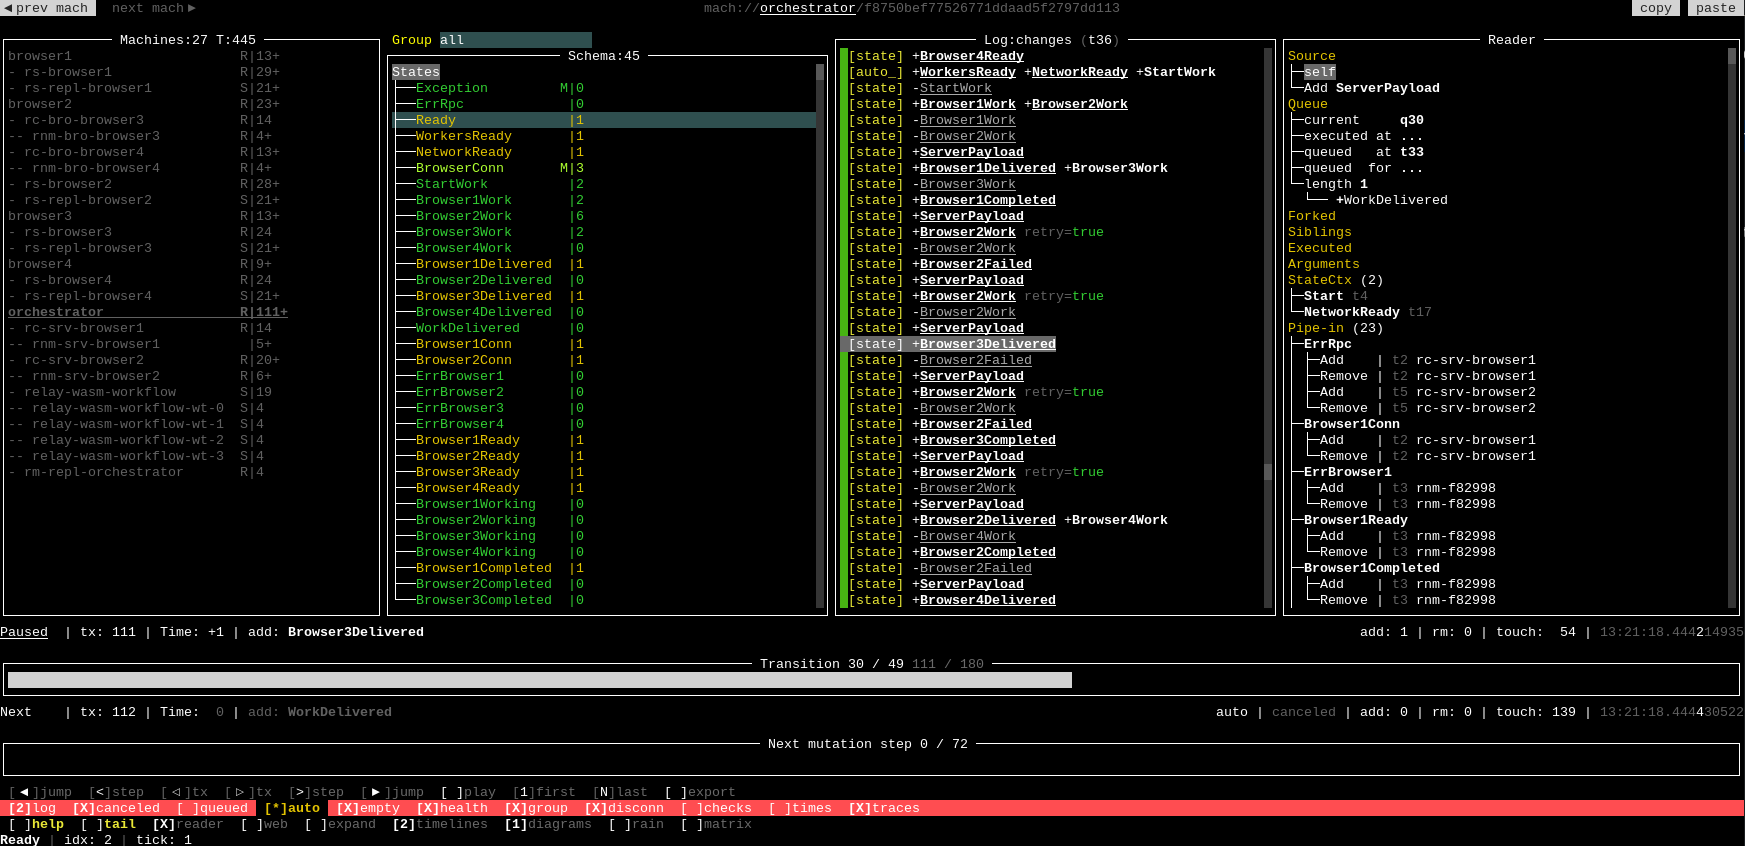
Interactively use the TUI debugger with data pre-generated by this example:
go run github.com/pancsta/asyncmachine-go/tools/cmd/am-dbg@latest \
  --import-data https://pancsta.github.io/assets/asyncmachine-go/am-dbg-exports/wasm-workflow.gob.br \
  --dir am-dbg \
  mach://orchestrator
Configuration
# CONFIG

RELAY_ADDR=localhost:14050
REPL_DIR=tmp

ORCHESTRATOR_TCP_ADDR=localhost:14000
ORCHESTRATOR_REPL_ADDR=localhost:14001

BROWSER_1_TCP_ADDR=localhost:14010
BROWSER_1_REPL_ADDR=localhost:14011

BROWSER_2_TCP_ADDR=localhost:14020
BROWSER_2_REPL_ADDR=localhost:14021

BROWSER_3_TCP_ADDR=localhost:14030
BROWSER_3_REPL_ADDR=localhost:14031

BROWSER_4_TCP_ADDR=localhost:14040
BROWSER_4_REPL_ADDR=localhost:14041

HASH_ITERATIONS=10000
EXIT_ON_COMPLETED=1
SUCCESS_RATE=5
#SUCCESS_RATE=500

# DEBUG

AM_DEBUG=1
AM_DBG_ADDR=1
AM_LOG=3
AM_LOG_FULL=1
AM_HEALTHCHECK=1
AM_SERVICE=orchestrator
AM_OTEL_TRACE=1
AM_OTEL_TRACE_TXS=1
AM_OTEL_TRACE_SKIP_STATES_RE=(^rm-|relay-|rc-)|(RegisterDisposal$)
#
AM_RPC_LOG_SERVER=1
AM_RPC_LOG_CLIENT=1
AM_RPC_LOG_MUX=1
AM_RPC_DBG=1
#AM_RELAY_DBG=1
Machine Diagrams
Diagrams of various levels of detail generated with am-vis.
Map Diagram
task diagram-map

Full Diagram
task diagram

Orchestrator Pipes Diagram
task diagram-orchestrator

Dispatcher Pipes Diagram
task diagram-dispatcher

$ task --list-all
task: Available tasks for this project:
* build:
* build-browser:
* build-browser-prod:
* build-orchestrator:
* dbg:                        Start am-dbg
* deps:                       List dependencies in deps.md
* deps-graph:                 Render dependencies graph in deps-graph.svg
* diagram:                    Generate am-vis diagram (requires am-dbg export)
* diagram-dispatcher:         Generate am-vis diagram for Dispatchers's pipes (requires am-dbg export)
* diagram-map:                Generate am-vis map diagram (requires am-dbg export)
* diagram-orchestrator:       Generate am-vis diagram for Orchestrator's pipes (requires am-dbg export)
* graph:                      Generate a network graph as markdown (requires am-dbg export)
* pprof:
* repl:                       Start REPL
* start:                      Build everything and start orchestrator
* traces:                     Start Jaeger at http://localhost:16686
monorepo
Go back to the monorepo root to continue reading.